TrustRadius
LogicMonitor

LogicMonitor

Overview

What is LogicMonitor?

LogicMonitor provides an agentless SaaS-based monitoring platform. LogicMonitor provides prebuilt integrations and an open API, and is designed to provide monitoring across networks, servers, applications, websites, and containers, including insights and reporting capabilities.

Read more
Recent Reviews

New LM Customer Experience

8 out of 10
June 20, 2023
We use LM in our organization to monitor a global network of 500+ windows and Linux servers. We have a small server team so we need the LM …
Continue reading
Read all reviews

Awards

Products that are considered exceptional by their customers based on a variety of criteria win TrustRadius awards. Learn more about the types of TrustRadius awards to make the best purchase decision. More about TrustRadius Awards

Reviewer Pros & Cons

View all pros & cons
Return to navigation

Pricing

View all pricing

Enterprise

Contact sales team

Cloud

Website Monitoring

Contact sales team

Cloud

Entry-level set up fee?

  • No setup fee
For the latest information on pricing, visithttps://www.logicmonitor.com/pricing

Offerings

  • Free Trial
  • Free/Freemium Version
  • Premium Consulting/Integration Services
Return to navigation

Product Details

What is LogicMonitor?

LM Envision is a SaaS-based unified observability platform that enables digital enterprises to adopt a cloud-ready operating model for meeting key business demands. LM Envision provides clarity across hybrid enterprise IT, brings diverse IT and development teams together to solve complex problems, and enables IT to innovate faster while improving operational efficiency to the critical IT services they deliver.

LM Envision aims to offer an alternative to the tool sprawl that exists in many organizations today. By leveraging a platform that enables collection, analysis, contextualization insights and exploration of observability data across traditional and modern environments, it helps IT teams to remove the blind spots that come from siloed monitoring tools. And it enables IT teams to rally around a platform that offers a “single source of truth” to quickly triage and resolve problems, leverage AIOps to spot performance trends, and shift their time and investment from operation tasks to work that drives innovation for the enterprise.

LogicMonitor Features

  • Supported: Infrastructure Monitoring
  • Supported: Network Monitoring
  • Supported: Cloud Monitoring
  • Supported: Logs
  • Supported: Server Monitoring
  • Supported: Remote Monitoring
  • Supported: AIOps (data forecasting, root cause analysis, dynamic thresholds)
  • Supported: Database Monitoring
  • Supported: Container Monitoring
  • Supported: Synthetic Website Monitoring
  • Supported: APM
  • Supported: Storage Monitoring
  • Supported: Virtual Machine Monitoring
  • Supported: Configuration Monitoring
  • Supported: Topology Mapping
  • Supported: Customizable Dashboards
  • Supported: Alert Escalation Chains
  • Supported: Reporting
  • Supported: Alerting
  • Supported: 24x7 Live Technical Engineer Support

LogicMonitor Screenshots

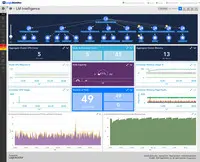
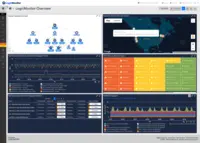
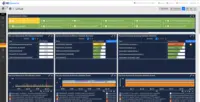
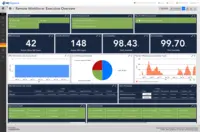
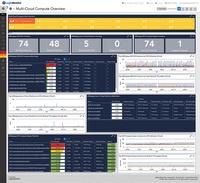
Screenshot of AIOps features for enterprises using technology or hybrid environments with cloud and container resources. LogicMonitor can be used to monitor and improve the performance of complex enterprise networks with dynamic thresholds, topology mapping, anomaly detection, and root cause analysis.Screenshot of LM Envision's comprehensive monitoring and observability capabilities across the IT infrastructure, that help to identify alerts for the most important systems while ensuring the user experience is uninterrupted across the globe.Screenshot of Monitoring that ensures servers and the applications running on top of them are highly available. Helps resolve issues and optimize resource consumption for the server infrastructure.Screenshot of LogicMonitor remote workforce monitoring, which ensures that employees are connected to the systems that keep them productive and provide proactive insight into dispersed systems and third-party outages.Screenshot of Unified cloud monitoring across a hybrid multi-cloud ecosystem.Screenshot of LM Logs delivering log analysis at enterprise scale.

LogicMonitor Videos

LogicMonitor helps Abrigo maintain 99.99% uptime
GCISD accelerates digital transformation with LogicMonitor
who is LogicMonitor?
Carrier partners with LogicMonitor in path to unified observability

LogicMonitor Technical Details

Deployment TypesSoftware as a Service (SaaS), Cloud, or Web-Based
Operating SystemsUnspecified
Mobile ApplicationApple iOS, Android, Windows Phone, Mobile Web

Frequently Asked Questions

LogicMonitor provides an agentless SaaS-based monitoring platform. LogicMonitor provides prebuilt integrations and an open API, and is designed to provide monitoring across networks, servers, applications, websites, and containers, including insights and reporting capabilities.

Datadog, PRTG Network Monitor, and Dynatrace are common alternatives for LogicMonitor.

Reviewers rate Support Rating highest, with a score of 9.

The most common users of LogicMonitor are from Mid-sized Companies (51-1,000 employees).

LogicMonitor Customer Size Distribution

Consumers0%
Small Businesses (1-50 employees)29%
Mid-Size Companies (51-500 employees)41%
Enterprises (more than 500 employees)30%
Return to navigation

Comparisons

View all alternatives
Return to navigation

Reviews and Ratings

(310)

Attribute Ratings

Reviews

(1-25 of 30)
Companies can't remove reviews or game the system. Here's why
Score 9 out of 10
Vetted Review
Verified User
Incentivized
I like how LogicMonitor is easy to set up and configure, plus it simplifies website and server monitoring. Also, whenever something goes wrong in your system, LogicMonitor will automatically notify you via email, phone, or any other way that you prefer. So you can quickly fix the problem or contact support to get it solved.
  • Easy to configure and set it up plus it simplifies both server and website monitoring.
  • Instant notification whenever something goes wrong in your system.
  • Quick and helpful support.
  • Quite costly.
  • Not easy to customize.
  • No other problem but a reduction in price would be much appreciated.
I prefer LogicMonitor over other similar monitoring systems despite its costly price tag. And we can keep tabs on everything from our website to our servers with it. Also, the initial setup was straightforward to follow and configure, so it is very much recommended that others try it.
Score 9 out of 10
Vetted Review
Verified User
Incentivized
Both the on premises and cloud monitoring system has been converted to LogicMonitor and thanks to that we can analyze and collect more specific data without worrying about our infrastructure cost. Also installation was easier than we imagined as the documentation to set it up was extensive and both customer service and LogicMonitor community was always available and friendly enough which accelerated the whole process. There is no other monitoring system that matches its low cost and ease of use.
  • No need to worry about the overall cost as it costs much lesser than it's competitors.
  • Has friendly community and support so whenever there is an issue, it quickly gets solved and the extensive documentation further makes the process easy to follow.
  • The tool's overall performance is great and the UI is updated frequently to fix bugs or improved user experience.
  • Further improvement is required in their mobile app. Since it has a lot of bugs which causes it to crash and start glitching.
  • Even though it can identify if there is an issue and report it, it can't automatically fix it or give the solution for the issue. So if there was such a feature, it would save us a lot of time.
  • That was all that the it needs to improve on and there are no other significant problem or improvement that it needs.
The ease with which LogicMonitor lowered administrative and infrastructure costs earned it great recognition. It lets us monitor our entire network and see what's happening with a very intuitive graphical user interface which is frequently updated to further increase it's performance. And among all of it's competitors LogicMonitor is the best and cost effective solution to use for your company.
Score 10 out of 10
Vetted Review
Verified User
Incentivized
It's great since we don't have to install bothersome agents on the devices or hardware that we want to monitor. I didn't even need to consult the instructions or contact customer support when I wanted to add a device; the process is simple and easy to follow. But if you still find the configuration to be too much to handle, technical assistance is always available to assist you. Finally, there is no downtime experienced whenever there is an update, hence giving us a smooth experience.
  • It doesn't require the installation of bothersome agents on the devices or hardware that we want to monitor.
  • It is very easy to set up and add new devices without going through the instructions or contacting support.
  • No downtime experience even during updates.
  • Has enough documentation if ever required.
  • Sometimes updates change the UI which I then need some time to get used to.
  • The type of alerts send through email is limited and less options are available.
  • Cost may increase significantly if number of devices increases.
It is excellent as no bothersome agents must be installed on the devices or hardware we want to monitor. Plus, they have great support even though you may never contact them, as LogicMonitor is very easy to set up and rarely has any issues. So I would recommend them as you won't get this smooth experience anywhere else.
Score 8 out of 10
Vetted Review
Verified User
Incentivized
Its been a couple years since we engaged LogicMonitor in organization. The platforms integration with cloud platforms has simplified our cloud resource management. We set up automatic scaling policies, and when our applications demand increased, LogicMonitor seamlessly expanded resources to handle the load. We have also leveraged it ability to identify issues before they impact our end users allowing us to address issues before they lead to server downtime.
  • The auto discovery capabilities have saved us countless hours. It automatically detects and monitors new devices and services when added to our network, ensuring we miss nothing critical.
  • The customizable dashboards are great
  • The forecasting tools have been instrumental in our capacity planning efforts.
  • Pricing and transparency. Shading more light into the pricing structure would be really appreciated especially by potential clients
  • The licensing is very costly.
LogicMonitor has been an incredible asset in our IT operations. Its capacity planning features have helped us optimize resource allocation. We are able to identify underutilized resources and redistribute them efficiently. We also set up automated alerts for server CPU usage. When a critical servers CPU usage exceeds a predefined threshold, LogicMonitor immediately alerts our teams.
March 01, 2023

One of best NPM tools

Score 9 out of 10
Vetted Review
Verified User
LogicMonitor is a fantastic NPM. We leverage it for monitoring our networking devices, cloud VMs, application servers, and storage servers in short we use LogicMonitor to monitor all of the infrastructure.
  • It captures and monitors devices down to the minute details, and accurate alerts are generated.
  • The UI is very good and modern looking
  • The site categorization looks very effectively
  • When a device is added, we enable all alerts; only the basics are enabled by default.
  • Mobile version is not good
LogicMonitor is very well suited for Medium to Large scale organizations. We can monitor a variety of devices, if any device does not report properly their support team helps us out and sometimes the engineering team also gets involved.
December 06, 2022

LogicMonitor Review

Score 8 out of 10
Vetted Review
Verified User
Incentivized
We use Logic Monitor to monitor our clients' devices and network connectivity. When we receive an alert from LM, we take action to resolve the incident.
  • Realtime monitoring
  • Captures historical data
  • Can be heavily customized
  • The customer success team is engaging
  • Better reporting options. We need to be able to report on connection up time % and are struggling to produce that.
We are enjoying the ability to review historical alerts within the app itself. previously we needed to rely on our ticketing system to capture this information. Its great at detecting drops in connectivity and is very visual. We would like to see improvements to uptime reporting and network topology screens that show the relationship that one device has with another.
Score 9 out of 10
Vetted Review
Verified User
Incentivized
LogicMonitor helps understand the severity of alerts so that businesses can identify which problem to resolve first. Also, it's not just a monitoring tool but a whole package of required applications. So rather than purchasing different applications to do the job, LogicMonitor would be a one-stop solution for all.
  • It monitors all the devices in organization
  • Best part is the log analysis which is way ahead from it's competition
  • APM are also the best to use
  • LogicMonitor tells us the average collected data for the last minute, while this seems to be a good value to look on, sometimes it's not a good idea to get those data and analyse them.
  • It should show the threshold reached while monitoring and keep that data as static to make other understand from the graph that the surge happened in the last minute.
  • A good mobile application is what we need currently from LogicMonitor, as this is now the era of mobiles.
  • To access the data from mobiles, LogicMonitor should build a robust network and access control system so that organizations can provide access to employees without even thinking of breaching the system security.
I was working with LogicMonitor and I saw that LogicMonitor collects all the data and keep that to create a graph, There is an option where I can edit those "numbers" to recreate the graph by myself, which is a very good thing to do as sometime we need to edit the data, not because of inaccuracy, but because we know our system and it can sometimes send false alarms with wrong numbers.

Although this is a good thing to have in LogicMonitor, on the other hand, this becomes a very bad thing as someone can easily manipulate the data and present it to management, stating that this data has been collected by LogicMonitor.
Score 9 out of 10
Vetted Review
Verified User
Incentivized
Two uses:
For Observability predominately, for end of month Availability and SLA reporting and capacity reporting.
For incident management by way of troubleshooting, performance analysis and timestamping of alerts and events, especially from data from the Azure API.

Forecasting trends and anomaly detection is still in its early days but I foresee greater use of this functionality as we mature in our use of this tool.
  • Reporting of SLAs
  • Alerting and threshold adjustments for criticality of alerts
  • Graphs for past performance and anomaly detection
  • Trending for future performance and capacity planning
  • Make it simple
  • Ops Notes is not per resource
  • Certificate expiry tracking could be useful
  • Synthetic monitoring of websites
Good for server monitoring. Some work required to report on Clusters or failover groups. We found a solution to report on this, but it was long winded.
We felt this tool was not suited for Networking devices as the topology function was complex.
Montoring of websites and network appliances meets our needs.
October 11, 2022

LogicMonitor Review

Score 9 out of 10
Vetted Review
Verified User
Incentivized
We use it for monitoring majority of our systems. The biggest advantage is fast adaptation compared to some other monitoring tools.
  • Easy to use thanks to the modern user interface.
  • Very little technical troubleshooting needed. Everything just works.
  • Monitored data is stored up to two years.
  • Mass editing.
  • No dark theme.
  • Mobile app could be better.
LogicMonitor is a perfect tool for sysadmins who don't want to spend any time on developing the monitoring tool, but rather just to use it. LogicMonitor is not a RMM tool so fixing the alerts will require some extra effort.
Score 9 out of 10
Vetted Review
Verified User
Incentivized
We are using LogicMonitor to monitor our server infrastructure. This is currently being used by our Server and Cloud team to monitor CPU, Memory, Disk usage, last reboot time, server online, server reachable.

We had three problems we wanted to solve with a monitoring solution:
-Stop managing the monitoring software and start using the software.
-Get valuable data on our environment.
-Get useful alerts on our environment.

LogicMonitor helped us reach each of those goals.
  • The built-in alerts are fantastic. By default all alerts are enabled. You can fine tune each alert as needed.
  • The deployment was quick. Within 4 hours I had about 90% of our environment configured in LogicMonitor.
  • The UI is quick.
  • The support and POC team are fantastic. They helped us learn about the product and helped us configure the solution for our environment.
  • The UI is quick, but it did take a little bit of time to get use to the UI.
  • Some tasks are not obvious on how to configure like getting WMI configured.
  • The UI is a little inconsistent throughout some of the pages.
LogicMonitor is great for AWS and Azure resources. You're able to pull info from each respective API.

For our environment, we use Windows and poll the bulk of our resources with WMI. We were specifically looking for Memory, CPU, Disk space, and last reboot time. LogicMonitor gets all this data that was a requirement for our solution. We're just scratching the surface on what LogicMonitor can poll for.

Now that we are capturing all these metrics, we're able to get useful alerts for those metrics. I found roughly 50 issues within our environment that simply went unnoticed because we were not looking for it. But LogicMonitor found the issues, and brought it up to our attention.

We're also able to see live metrics on our systems. We've already made data backed changes to increase our workflow on some of our applications.
Score 10 out of 10
Vetted Review
Verified User
Incentivized
LogicMonitor is used to monitor IT operations systems and services. We moved from SCOM so that the TEAM could have an easier experience managing the basic service monitoring environment and have reliable alert notifications with escalation.
  • Easy to use interface.
  • Easy to tune monitors.
  • Easy to collect data and push to cloud.
  • Quick to setup.
  • Support is awesome!
  • Better Microsoft Teams Integration with cards that have escalate, Ack, STD, comments buttons.
  • Customization of built-in email notifications without setting up Integration.
  • ESX password confirmation.
  • Standardized rest API authentication for 3rd party dashboarding like from SquaredUp.
  • Improved error notification for events that show "no data."
Basic monitoring of servers and services has served us well. These are the basic availability monitoring of CPU, memory, disk, and connectivity. More advanced Microsoft Services from on-prem ADDS to Azure AD Health have not been very good or UCS Hardware or even the awareness of Hyper-V Clusters. Vcenter monitoring could be improved around instance monitoring.
Score 9 out of 10
Vetted Review
Verified User
Incentivized
It is used for firm-wide monitoring alone with few other cloud-based solutions. The network team uses it for all device monitor, configuration tracking, and some network automation.
  • You can run python code to do certain things which are not possible in other monitoring vendors.
  • Easy to navigate the GUI.
  • Low cost.
  • Upgrade was buggy once a while. The GUI is not actually as good as before.
  • Data can go missing. We lost data and went nowhere with support.
  • Very lacking in terms of netflow, too limited for a mid-size firm. The number of flows per box is too low and data can be completely off. We cannot trust the NetFlow report.
  • Support is not the best for sure. Alot of problems were not resolved until escalation to senior management.
Automation and cloud-based monitoring can be very useful. We can set up all kinds of tests from each office and from AWS to test network performance and detect issues.
Score 9 out of 10
Vetted Review
Verified User
Incentivized
We use LogicMonitor as a monitoring tool to support all our customers environments. We have 130+ customers associated and we are monitoring their environments using LogicMonitor. Mainly for Servers, Databases, Websites and other Application checks. It makes our work a little easier as once we add a device (server) to LogicMonitor, it discovers all its parameters and loads it on the console so that we can pick whatever we need to make monitoring live. Also, we have an option for using custom scripts for any new type of monitor based on customer request. Tuning of alerts and notifications to customers and other support team is very easy, clear with this tool.
  • When we add a device, all of its components/parameters will be discovered automatically and it makes our job easier to pick which parameters that we need to monitor.
  • As it is agentless, with a single collector we can monitor 100+ devices and possibility of customization depending on requirement.
  • Excellent alert tuning and alert routing functionality has been configured.
  • Integration is at its best as we can integrate with third party ticketing tool, mails and we can even send text messages and also voice calls for alerts.
  • It can improve more on collection method time for certain Logic modules and identifying issue using troubleshooter.
  • Need more customization to deploy shell scripts to monitor our Oracle application environments.
  • Always can improve in adding more new type of additional monitoring type to improve of the scope.
With the current monitoring tool which we have, for every server we need to add multiple monitors which consumes lot of time and the environments where there are multiple devices, apps, switches, databases that needs to be monitored. LogicMonitor comes into the picture and will help to deploy monitoring of different environments within a short amount of time.
Best alert routing and alert tuning tool which we used so far and has helped in identifying a lot of critical issues.
January 12, 2021

LM Review

Manishh Arora | TrustRadius Reviewer
Score 10 out of 10
Vetted Review
Verified User
Incentivized
We use LM for our customers. This gives them a unified view of what's going on.
  • Dashboards.
  • Alert Deliveries.
  • Custom DataSources.
  • Integration with AWS, Google Cloud.
  • Mobile Application.
  • Showing Absolute numbers in the dashboards/graph instead doing average/sum.
Well suited where an organisation wishes to have a unified view of hardware stats and software stats... single monitoring window.

Less appropriate for those who need to know absolute numbers of data coming in instead of getting average of minimum 1 minute in the graph. For example, my application is sending 1 requests/second...Now what LogicMonitor does is, it doesn't show per second graph...It will wait for 1 minute and average out requests which is a pain. I will never come to know the surge as it averages down the number. And moreover, this is available in all freeware too.
Score 9 out of 10
Vetted Review
Verified User
Incentivized
LogicMonitor is one of the well-organised tool in the market and very easy to adapt to any industry. It has everything that you need for your company. We have been looking for more than 2 years [for a] tool like LM. This is the latest cloud-based monitoring tool that can monitor the cloud apps.
  • Easy to access.
  • Cloud monitoring.
  • Agent-less monitoring tool.
  • You need to learn the Groovy script.
  • WMI Troubleshooting.
  • SN integration.
Score 9 out of 10
Vetted Review
Verified User
Incentivized
We use LogicMonitor here in IT at my company to manage our servers, as well as our underlying infrastructure. In addition to it providing a baseline level of monitoring, we also use it as our configuration backup for our networking gear. We like it primarily due to ease of use, and ease of ability to access current and historical information. It also seems like it would be a great tool to monitor for proactive remediation of some issues, but we haven't really had the staff-time to get it set up how we'd like for that.
  • Ease of configuration.
  • Ease of viewing the data.
  • Robustness of data collected.
  • Alerts page filtering is confusing.
  • Took a bit to get Windows Server service monitoring set up.
  • Haven't found a good way to have LM itself handle proactive remediations without doing something hack-y on escalation chains.
I think LM is great if you're looking for a good, easy to use monitoring tool that is highly extensible. You can find modules for almost anything (I've even heard of it being used to monitor beer keg status at their own office!). It's great for getting a ton of visibility into your environment while also minimizing setup time.

It does lack in the automated proactive remediation department; I haven't found a way to do that easily yet. And while its tuning is very good out of the box, I have yet to find a monitoring tool in general that doesn't require any tuning, and LM is no different here. And while you can send Netflow data to it, it seems like it's no replacement for a full-on NMS, though it can work very well in conjunction with one.
December 14, 2020

Customizable Monitoring

Score 10 out of 10
Vetted Review
Verified User
Incentivized
LogicMonitor is great at automatically collecting many base metrics for our devices and services (like SQL server). It also allows you to expand the base collections using datasources, including completely customizing it to get data from your own collections. It can be somewhat cumbersome to get started, but their support is helpful.
  • Graphs are very easy to navigate/zoom in/out.
  • Can create custom dashboards.
  • Can pause alerts during maintenance windows.
  • Receive alerts based on predefined thresholds.
  • Mobile version is not great and using the website on phone is nearly impossible.
  • It can be challenging to use the different collectors and JDBC collector has some flaws.
  • The auto-sliding is not working very well.
Ability to use datasources/data collectors to get custom data into LogicMonitor. Creating custom dashboards is also very helpful.
Score 10 out of 10
Vetted Review
Verified User
Incentivized
LogicMonitor is being used by a department, to monitor and provide analysis to companies seeking remote support capabilities. It helps to view and create in-depth analysis of systems and issues arising that cannot be found from bare troubleshooting. Clients require monitoring support and LogicMonitor provides that edge to thoroughly check network, systems services and databases.
  • In-depth database reporting on mount points, luns, etc.
  • Networking reporting. Get alerts on network degrading.
  • Server reporting on server health and status. Uptime.
  • Website links reporting when it is down.
  • Robust app not just for viewing alerts.
  • Additional connectors to work with a wide range of software for automation.
  • More user friendly reporting for end users to understand.
One scenario is monitoring a client network and server infrastructure, LogicMonitor is perfectly suited for this. Also, based on the times we are in, remote monitoring is a must and it allows employees to work from anywhere utilizing cloud based services to view alerts and troubleshoot accordingly. The app also proves a great tool.
December 14, 2020

Ease of use

Score 10 out of 10
Vetted Review
Verified User
Incentivized
[LogicMonitor] is our unified infrastructure monitoring tool, before we had [LogicMonitor] there were multiple monitoring tools sending signals where our SRT folks have to spend some time log in each tool to gather more data, making LM as one unified Infra monitor tool has reduced MTTR, This also reduced our administrative over head as this is a SAAS platform.
  • Infrastructure monitoring out of the box
  • Good integration with ITOM module of ServiceNow
  • Easy Learning curve, and ease of use.
  • Synthetic transaction monitoring
  • Application performance monitoring.
  • Fedramp certification.
[LogicMonitor] is a awesome infrastructure monitoring tool, it support's various tools and technologies out of the box which is a huge plus. Since this is a SAAS platform this has greatly reduced our administrative overhead and helped us concentrate on bringing in various metrics from different devices and applications which is a good thing.
Score 9 out of 10
Vetted Review
Verified User
Incentivized
I resolved many problems with memory and CPU issue. We improved many changes before that alerts. LogicMonitor is the best monitoring system in the world. Also, we can start some services in our systems when they stuck or were down. We can fix many problems in our platform after our clients create a ticket in our Service Desk tool, we can work on the problems faster and more efficiently.
  • Fix performance issues.
  • Monitoring server health.
  • Monitoring services.
  • I need to see more tools like Splunk or something like that.
  • LogicMonitor needs to have more tools to make integrations with Power BI or Tableau.
  • The search in the alert dashboard causes confusion in our coworkers.
Our dashboards help us a lot in resolve our issues faster. Also, all types of the alerts can help all our company make important decisions to increase our efficiencies in our platform. LogicMonitor is our most useful tool in the company because we can fix many problems in our platform and have all our systems up and running for a long time. Our SLAs in LogicMonitor make a quick response for issues in our servers or services.
Score 4 out of 10
Vetted Review
Verified User
Incentivized
LogicMonitor is being used in our datacenters to provide an in depth overview at a glance and also granular alerting to specific events within our environments.
  • Great granularity.
  • Robust monitoring for all types of devices.
  • Easy to understand dashboards.
  • On-boarding is cumbersome.
  • Steep learning curve compared to other products.
  • Ease of use is not even considered.
LogicMonitor is great for network monitoring, providing in depth reports on all aspects of a firewall.
December 10, 2020

Monitoring made easy

Score 10 out of 10
Vetted Review
Verified User
Incentivized
We utilize LogicMonitor to provide us real-time monitoring and alerting of our public-facing production ERP system, FTP, and Network. We are able to monitor Azure Cloud Services, Netflow data from our NexGen Firewalls, Website uptime, SQL Services, and trends as well as a variety of other tools.
  • Very easy GUI to understand and read.
  • Lots of great ready to use dashboards.
  • Easy integration with Azure.
  • Lots of great out of the box services, the SQL tools in particular are outstanding.
  • Enhancements to the product have been great while using it.
  • Mobile App is essentially non-existent other than being in the app store.
  • Possibly more templates that are very specific and then allow a picklist (easy checkboxes) of resources instead of typing in more resources or creating a new group.
I am very happy with the product and don't have many negative comments to relay to a potential customer. I recommend the product for monitoring your network and traffic. There are tools that may be more specific for a certain project but for the price point, you get what you need and much more. I would happily purchase again.
Score 9 out of 10
Vetted Review
Verified User
Incentivized
Information Technology utilizes LogicMonitor for all SNMP monitoring and SaaS monitoring as well as alerting for the enterprise and IT teams.
  • Dashboards
  • Notifications
  • Cloud access/hosting
  • A little more detail or 'ease of use' for reporting outside of the can info
  • I'd like to see easier ingestion of devices that aren't already built in. Being able to update/upload MIBs directly or some way to ensure we can use any SNMP device.
Anyone needing reliable monitoring of SNMP and other web related assets. Easy. Love the iOS app and wish it could do more but it allows me 'basic' view into my dashboards.

Really a nice product.
Score 8 out of 10
Vetted Review
Verified User
Incentivized
We use LogicMonitor within the IT group to monitor all servers, network devices, and other various equipment. The main business problem this software solves is providing a single pane of glass to monitor every critical device within our environment, mainly via SNMP.
  • Supports a large set of common devices
  • Technical support is fairly responsive and helpful
  • Web GUI is fairly well designed and there is an app to go with it for mobile access (service is cloud-based)
  • The less common vendors are not supported and even some subsets of monitoring of common devices is not included out of the box
  • Certain types of monitoring and dashboard graphs are a bit confusing to get working and require some extra effort
  • Better syslog monitoring and alerting functionality, as they drop anything less critical than warning
Good for monitoring of the entire IT infrastructure, at least for any devices that support SNMP. Organizations with smaller IT infrastructure teams would benefit the most as the collectors are fairly easy to set up, making global deployment fairly easy and fast compared to traditional onsite deployments of other platforms. Organizations that require very deep and customize-able/specialized monitoring might want to go with separate, platform specific or custom monitoring platforms.
December 04, 2020

My LogicMonitor Review

Score 9 out of 10
Vetted Review
Verified User
Incentivized
Our company uses LogicMonitor for all our sites globally. We have hundreds of devices being monitored with this solution. It does provide good monitoring and alerting for network devices, servers, and infrastructure overall. SMS/Cellphone call to notify about critical alerts is definitely a useful and powerful tool for our company.
  • Monitoring
  • Historical Overview/Usage
  • Alerting
  • Dashboard widgets can provide more customization
  • Datasources for new software need to be updated usually with support help
  • Ways to setup an alert or notification based on widgets triggers
Network and server monitoring and alerting are the best scenarios for LogicMonitor capabilities and features. I wouldn't recommend for telephony call records lookup (haven't seen this anywhere else). The interface is quite intuitive and user friendly. It's definitely a must if you need to make sure all components and links are up and working as expected.
Return to navigation